Splunk

Enterprise Data Visualization & Analytics
At Splunk, I worked on improving the data visualization and analytics dashboard experience for enterprise users. The project focused on making complex data more accessible and actionable through intuitive interfaces and clear visualizations.
Through careful consideration of enterprise user needs and data complexity, we transformed how organizations interact with their data. The redesign emphasized clarity, efficiency, and actionable insights while maintaining the powerful analytical capabilities that Splunk is known for.
Role
UX/UI Designer
Timeline
2019
Tools
Figma, Adobe Creative Suite
Key Features


User Interface
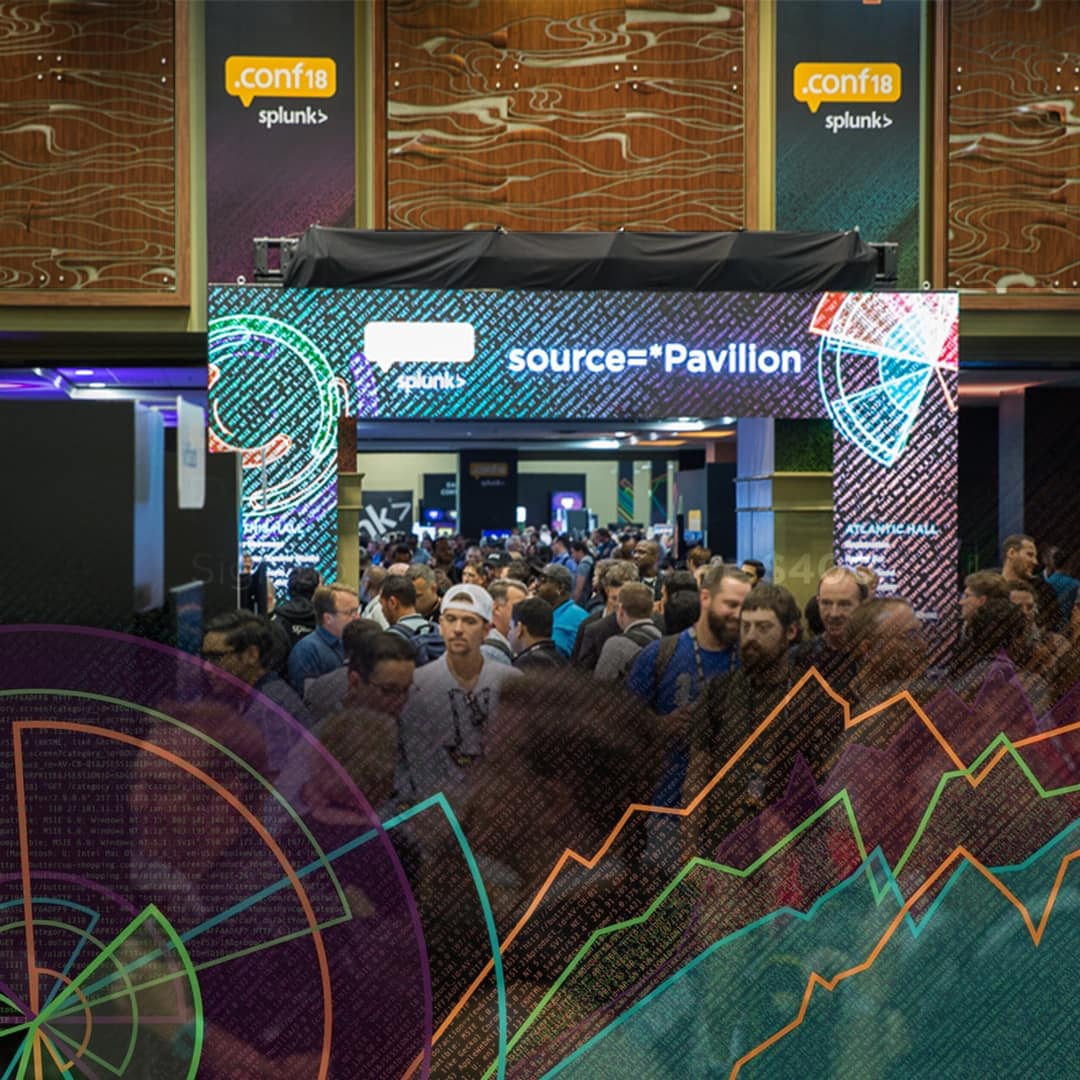

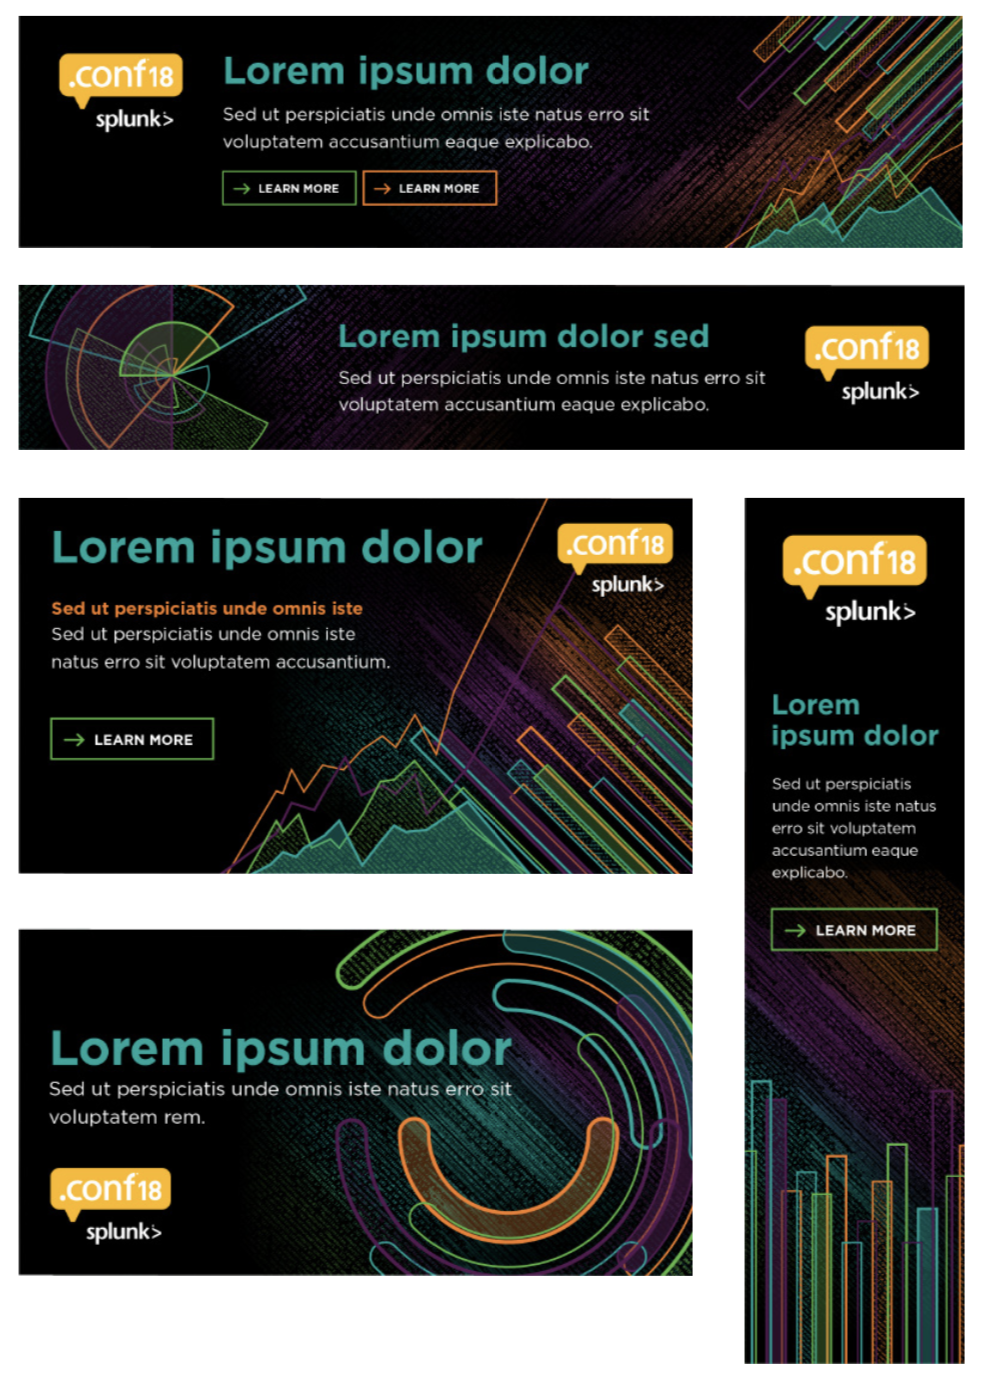
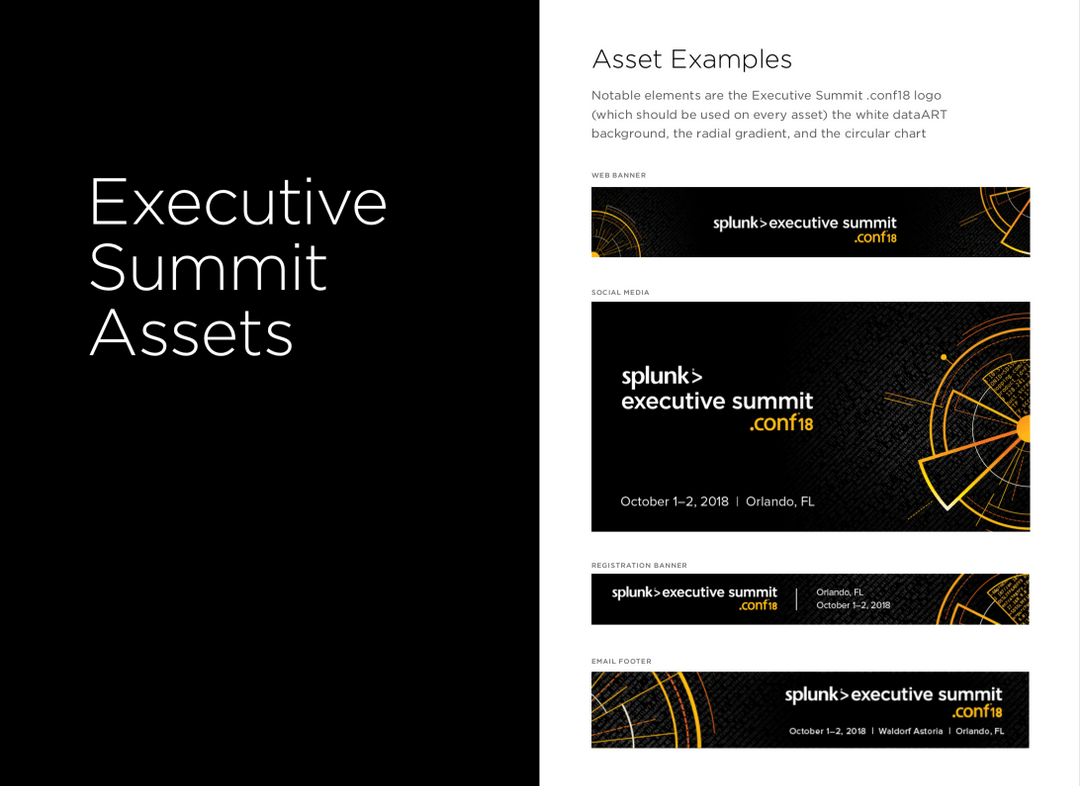
Events & Marketing